
I discussed this topic in greater length in Section 3.5 of my book Breakeven Inflation Analysis. The conclusion was not entirely satisfactory: we do not have enough data to do a proper historical analysis of breakeven inflation accuracy. The exception might be the United Kingdom, which started issuing inflation-linked bonds in the early 1980s. However, the bizarre structure of (old) U.K. linkers meant that it would take a lot of work to examine the returns for historical bonds. The Bank of England does publish historical real/nominal/inflation yield curves, but I would be a lot happier if I could compare “physical” bond yields to the fitted curve.
The U.S. TIPS market is shorter-lived, and for those of us using Fed data, the time series start in 2003. Other markets are not that much more helpful. Canada started issuing linkers in the early 1990s, but they were at the 30-year tenor. This means that only one bond matured (the 2021). This means that N=1 for the analysis that we want to do.
Money Market Maturities a Problem
The Church paper used Treasury data, which included a 6-month tenor. The forecast quality was bad using that data — but I would be greatly concerned about the data. The problem is straightforward: there are no money market maturity TIPS issued. The only way to get a 6-month breakeven is to look at heavily off-the-run notes/bonds.
Furthermore, any curve fitting algorithm tends to blow up at the ends of the maturity spectrum of the fitted bonds. We can hide this for conventional bonds by slamming in money market instruments to lock down the fit line at sensible levels. We cannot do this for linkers.
The key thing to keep in mind that the quoted yield (“real yield”) is a residual: it is the “difference” (approximately) of the well-defined nominal curve, and the breakeven inflation curve. Although this shocks some people, there is no firm relationship between spot inflation and short-dated nominal rates. This means that real rates can spin off to “extreme” values at the short end. So fitting a real yield curve is a garbage generation exercise.
If we fit inflation expectations, we run into the problem that we typically work with annualised inflation rates of non-seasonally adjusted headline inflation.

The figure above shows the problem. Economists and financial commentators generally work with seasonally adjusted data for a reason. The above shows the annualised 3-month rate of change of headline NSA CPI (which is what TIPS are indexed to). Even during the period of inflation stability of the mid-2010, the 3-month rate of change routinely ran between negative values and 5%. The 6-month rate of change is more subdued, but if you are fitting a “6-month breakeven inflation” and the closest bond maturity is 3-months, this is what the point you are fitting looks like (assuming perfect forecasts).
We then need to be very careful about the calculation. We need to figure out the exact daily interpolated CPI series that are used in indexation calculations. The calculation uses a 3-month lag to allow for index publication delays. (This lag means that for very short breakevens, there can be a considerable amount of known information for the final fixing.)
The upshot is that unless I did the calculations myself, I would be extremely cautious about anything referring to the accuracy of money market breakeven accuracy.
What About Longer Maturities?
If we look at longer tenors, the Fed H.15 fitted curves are perfectly adequate for econometric analysis (although relative value trading probably needs granular bond level data as well). The seasonality effects are attenuated over a multi-year annualisation, and the fitted tenor is closer to more liquid bonds.
For the 5-year, the Fed H.15 data looks is as shown below.

The black line is the annualised CPI inflation over a 5-year horizon that was realised after a given calendar date; by necessity, it ends in December 2016. The red line is the 5-year breakeven inflation from the Fed H.15, which starts in 2003. If the red line on a date is below the black line, it meant that breakeven inflation rate was too low, and so TIPS outperformed conventional Treasuries.
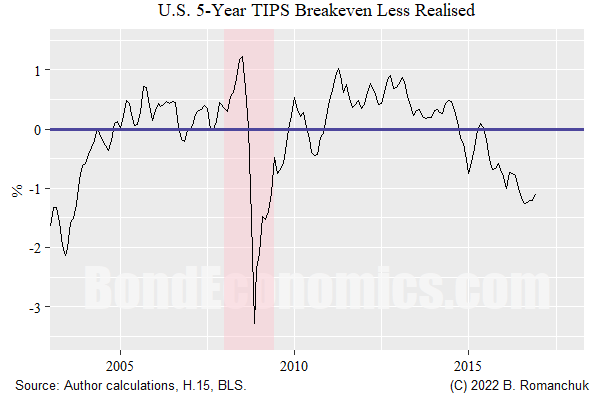
- Until mid-2004, the breakeven inflation rate was way too low. In the early years of the TIPS market (as well as the Canadian linker market), breakeven inflation rates were stupidly low. Basically, whenever portfolio managers looked at those breakevens in later years, they winced. (One of my few early institutional research pieces that caught attention was one noting the mispricing.)
- For the mid-2000s and mis-2010s, the breakeven was “slightly” too high. This could either be chalked up to an inflation risk premium, or the market was surprised by inflation being persistently below where the Fed wanted it (which was a consensus view).
- The breakevens were fairly horrible around the Financial Crisis. Going into the crisis, there was an oil price spike that had a large effect on headline inflation. Once the crisis hit, breakevens were well below any reasonable estimate of future inflation. The reason is straightforward: being long breakevens was a consensus balance sheet intensive trade, and those longs were mercilessly liquidated when financing dried up. For anyone with liquidity, it was easy to find bargains elsewhere, and so there was no move to “bail out” the trapped longs.
- At the end of the forecast horizon, 5-year forecasts were blindsided by the pandemic inflation surge.
What Can We Say?
I would argue that there are only a couple of conclusions we can draw from this data set — and frankly, both are obvious.
The breakeven inflation is driven by market participants, and at best, they are forecasters, not clairvoyants. They were unable to forecast the oil price spike in 2008, nor the pandemic inflation. Unless one fell for the “wisdom of crowds” nonsense, that is hardly a surprise. The real question is whether breakevens are better than other forecasts.
Market conditions can “blow up” the breakevens versus forecasts. One could be an academic and drone on about risk premia, but we should not forget that even the Treasury market can be affected by financing concerns. The question that matters is how much this shows up in “normal” times?
The other concern is the lack of data. We do not have enough independent data points to get too fancy. The principle is very simple: an “unexpected” inflation spike in 2021 will blow up 5-year forecasts in 2020, 2019, …, 2016. No matter how many trading days are in those years, the realised inflation we are comparing to are being blown up by the same “event.” Although I have seen academic econometricians come up with theories that suggest that they can work around this problem, there is no information free lunch. You really need a lot of non-overlapping data intervals to have any confidence. The problem that you then run into is that structural changes will probably hit the market before you get through a couple of those intervals.
In summary, any analysis of this sort needs to be taken with a large heaping pile of salt. You need to look at plots of time series, and then line up behaviour with what you know about market history.
No comments:
Post a Comment
Note: Posts are manually moderated, with a varying delay. Some disappear.
The comment section here is largely dead. My Substack or Twitter are better places to have a conversation.
Given that this is largely a backup way to reach me, I am going to reject posts that annoy me. Please post lengthy essays elsewhere.