One practice of economists that draws a lot of complaints is the use of subsets of the consumer price indices. Most commonly it is core CPI – excluding food and energy – although there are fancier measures like median CPI (which I describe below). Meanwhile, if a component of the CPI rises a lot in a month, commentary will often state things like “if we exclude {whatever had a price spike}, then CPI increased by only 0.2% on the month, instead of 0.5%.” (As should be expected, complaints are only about excluding items that rose quickly, everybody is happy to throw away the effects of items that fall rapidly in price.)
Note: This is an unedited rough draft of a book section. It is the long form version of a discussion I sketched out last week. Right now, I have done the minimal amount of data analysis, but I expect to add a bit more later.
There are two ways of viewing these recurrent controversies.
If we want to view the consumer price index as a proxy for change of the cost of living over a historical period, we need to include all items.
If we want to discuss the future developments of the consumer price index, we often want to find the underlying trend of the price level, which is often better captured by variant index constructions.
Historical Cost of Living Proxy
If we want to know how much the “cost of living” changed over a historical period, we need to use all the items in the consumer price index. (As discussed in Section 1.2, the CPI does not exactly capture the “cost of living,” but it should hopefully be close to whatever that nebulous number is.) Since this is what most people are interested in within the context of inflation, they can quite reasonably be miffed with economists who keep excluding the price changes of everything that went up a lot.
As such, it is no surprise that this is an extremely common complaint in internet discussions around inflation data releases.
For Looking Forward, We Often Want an Underlying Trend
Nevertheless, economists and market commentators are not paid to discuss historical changes in the CPI. Their interested in forecasting.
Forecasting inflation is difficult and controversial. (This explains why I am not approaching the subject in this introductory text.) Although there are many different forecasting methodologies, most only hope to capture the broad trend in the CPI, and not every single wiggle in prices. And in order to discuss the future trend, we need to know what the current trend is.
This largely explains why economists and other commentators try to remove the “noise” from inflation data. The idea is that even if they can predict the CPI at a future data exactly, their methodology will on average give good results. Sometimes the estimate is too high, other times too low, but the errors should balance out (and not be too large).
Since market and economic commentary is almost entirely about forecasting, this means that the use of variant inflation measure that strip out “noise” are common.
Differing Variants
Although researchers are free to invent any number of ways of extracting the underlying trend in inflation, I have seen two main variants used in practice.
The use of core measures: exclude volatile items, mainly food and energy, although there are variants in different countries (depending on the local CPI definition).
Use of statistical tools to eliminate “outlier” price changes, which are identified each month, and not assumed to be fixed item types. Two versions of this are the median CPI, or various trimmed mean measures. (Researchers are free to tune the parameters of a trimmed mean price index.)
For simplicity, I will just stick to the median CPI herein. The most well-known variant of this in the United States is calculated by the Cleveland Federal Reserve. The Cleveland Fed has a page with the latest release, as well as links to research paper in this area here: https://www.clevelandfed.org/our-research/indicators-and-data/median-cpi.aspx
On this page, the median CPI is defined as:
Median CPI is the one-month inflation rate of the component whose expenditure weight is in the 50th percentile of price changes.
A simpler to understand version of this is as follows (with some mathematical corners cut).
For a particular month, take all the underlying components of CPI, and create a table with their monthly price change and their weight in the CPI. (The sum of the weights will be 100% unless you are doing something wrong.)
Sort the table of items by the monthly price change, from highest to lowest.
Go through the list and find the line in the table where the sum of the items above it and below it are both 50%. (In practice, you need to adjust for the fact that one item will straddle the 50% mark.)
The median CPI change for the month is the price change for the line found in the previous step. You can then cumulate the changes each month to create a median CPI index.
This number is typically different than the mean (or average) of the monthly changes, which is calculated by multiplying the price change for each item by its weight. (The mean CPI is the standard calculation method for the CPI.)
For example, imagine an index that conveniently has three items with equal weights. The monthly price changes are equal to +0.1%, +0.2%, +0.5%.
The average monthly CPI change is (0.1 + 0.2 + 0.5)/3 = 0.267%.
The median CPI is the middle entry of the sorted list of price changes, or 0.2%.
In this example, the median is lower than the mean because the median does not care about the magnitude of the changes at the wings of the price changes, so it does not care that the item with a high change (0.5%) is further above the average than the item below the average (0.1%).
(A trimmed mean index starts off like the median calculation, but instead of just finding the middle of the distribution, the calculation lops off a certain percentage of the weighting at the top and bottom of the sorted list, then averages the remaining changes.)
If we make the bold assumption that price changes are random around a central trend point, and the probability distribution is symmetric around that trend point, then the median should be less affected by the random noise, and so the median CPI should track the underlying trend better than the standard CPI calculation. (As I discuss below, I am somewhat concerned about that assumption.)
How Well Do the Variants Do?
TK: Add more countries to this section, but leave with just the United States for now.
From my perspective, I am quite happy to eyeball charts and accept that core or median CPI “looks like” an underlying trend for the CPI. However, once we are making qualitative arguments like that, not everyone will agree. Academic economists insist on using statistical tests for such matters. For reasons that I will discuss below, I am somewhat concerned about the use of statistical tests in this context. However, I think I can do an easy to replicate justification for the concept, that does not require outlandish assumptions about the dynamics of inflation.
My argument is simple: if a measure of inflation is close to the “underlying trend” for prices (assuming an “underlying trend” exists), future values of inflation should be expected to end up close to that trend. (If the trend is rising or falling over time, we run into problems.)
The easiest way to look at this is to compare the current value of the annual headline inflation rate versus the value for the competing measures of inflation the year before. (I use one year so that there is no overlap in the forecast period and the inflation rate calculation period.) That is, I compare headline CPI inflation versus its value the year before, or core CPI inflation the year before.
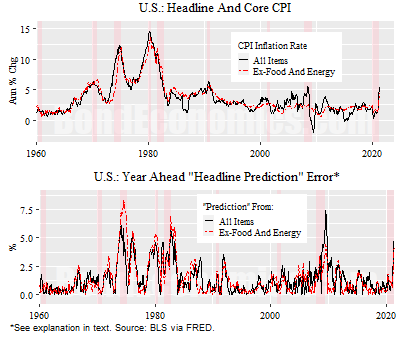
The chart above shows the results graphically for the United States for the period to 1960 until mid 2021. The top panel shows the annual inflation rates, which is standard. The bottom shows the absolute value of the difference between headline inflation and the year before (lagged) values of headline and core CPI.
There is absolutely no doubt that the bottom panel is visually a mess. The “forecast errors” are large, particularly in the high inflation era. We can get a bit more information if we look at the averages of the errors.
Over the 1960-2020 period, the core and headline “prediction” were almost equally bad. Headline had an average error of 1.39%, core had an error of 1.36%.
If we look at the period of 1990-2020 – a period where the underlying trend to inflation was flat – core outperformed headline, with an average error of 0.94% versus 1.13%.
I will not lie, that is not a very convincing difference. However, the problem is that we are attempting to predict the volatile series. What if we wanted to predict the less volatile one?

The figure above shows the “prediction” errors if we want to predict core inflation. In this case, we see that core inflation is much better at “predicting” its future values, particularly for the low inflation era. In the period 1990-2020, the average “prediction” error for core inflation by core was 0.45%. (Headline also had a better read on core, with an average error of 0.72%.) This is half the “prediction” error for headline.
To summarise, if we accept the working assumption that core inflation is a reasonable proxy for the underlying trend to overall CPI inflation, it does have the useful property that future values tend to stick near its past values in an overall flat inflation environment. (In an environment like the 1970s, we would need to be able to predict the increase in the trend over time, which my experiment is not attempting to do.)
Structural Changes the Problem
I have not pursued the analysis for things like the median CPI because they face the same underlying problem that my core CPI analysis faces: the use of core as a proxy for the underlying trend in inflation breaks down if the economic structure changes.
As previously noted, we face a problem if the underlying trend is rising (or falling). In this case, we should not expect inflation to revert to its historical trend value, rather a rising (or falling trend). Guessing how fast the trend is moving is a nasty problem. We need to look at the rate of change of the rate of change of the price level, which mathematically resembles taking the derivative of the inflation rate. If we look at the results of engineering systems theory, taking the derivative of time signals magnifies high frequency noise in the signal. That is, the predicted rate of change of inflation will swing wildly in response to the jumpy inflation series.
Furthermore, the use of core inflation poses particular risks: we are introducing a deliberate bias to the price changes. As a long-suffering sympathiser to Peak Oil arguments, I believe that it is entirely likely that energy prices will outstrip overall CPI in the long term. (As many Peak Oil enthusiasts on the internet discovered, that long term can be very long.) Meanwhile, the less processed the food use consume, the greater the effect of energy prices on production costs. (By contrast, a meal in a restaurant has entire layers of labour costs and other overhead like rents embedded in the costs). The ability of energy prices to rise faster than overall CPI was a feature of the 1970s.
Statistical variants like the median are less susceptible to the component bias shown by the core, but they still rely on assumptions that could be wrong. All it takes for large price changes to be clustered in one direction – e.g., large price increases are more common than small ones – to give a bias to the median versus the standard CPI.
The other issue with statistically defined variants of the CPI is that their proposal is biased. Academics would ignore any CP variant that is less useful than the overall CPI, and so they will not appear in the literature. Therefore, one can assume that there is 100% chance that any variant CPI will be “better” in some statistical sense for analysis than the standard CPI definition. The problem is that the statistical tests used to determine the quality of the definition of the inflation metric implicitly assume an underlying mathematical model. That model presumably fit historical inflation regimes well. However, there is no guarantee that the regime will not change.
As a result, I am quite cautious about the claims about these statistical variants.
Concluding Remarks
Commentators generally do not use alternate inflation metrics because they are part of some conspiracy to explain away inflation. It is entirely reasonable to want to strip out the noise in inflation data. That said, using those measures is not an appropriate way to proxy the cost of living. Furthermore, there is no guarantee that those alternate measures will capture exactly the underlying inflation trend.
References and Further Reading
Cleveland Federal Reserve web page on the median CPI, which also has links to research articles on statistical price index variants. https://www.clevelandfed.org/our-research/indicators-and-data/median-cpi.aspx
No comments:
Post a Comment
Note: Posts are manually moderated, with a varying delay. Some disappear.
The comment section here is largely dead. My Substack or Twitter are better places to have a conversation.
Given that this is largely a backup way to reach me, I am going to reject posts that annoy me. Please post lengthy essays elsewhere.