
Matthew C. Klein also recently joined Substack, and wrote a lengthier piece on it. If the reader has not already gone through the details of the report, Matthew’s piece is a good place to start.
I will largely not comment on what he wrote, other than the big point he notes: there was a divergence between the Household and Establishment job growth numbers.
Reminder: Feedburner email support is disappearing this month. You need to opt in to my free Substack to get my articles by email.
As a minor note, he did question the strength of employment growth in dentistry. This is actually not too surprising. My hometown newspaper (The Montreal Gazette) had an article during the height of the pandemic on the situation for dentistry. Ever since the AIDS epidemic in the 1980s, dentists have always been trained to deal with infectious diseases. All they really needed to do was improve ventilation, and stagger patients, and they could continue. For my family, we all kept our usual dentistry schedules at different dentists. The need to space out appointments more (to avoid having multiple people in the waiting room) might mean that they need somewhat longer hours and thus slightly more employees for the same patient flow.
I will now return to Household versus Establishment divergence. As is described in the labour market news release from the U.S. Bureau of Labor Statistics (BLS), there are two surveys done: a random survey of households, as well as a survey of business establishments. (Link to the release — note that this link may be to the “latest” month, and numbers may not align to what I am writing if the latest month is not June 2021.) In June, the Establishment Survey had a punchy 850,000 jobs added on a seasonally-adjusted basis, whereas the seasonally adjusted Household Survey recorded a loss of 18,000 jobs.
What should we believe, and why?
A Digression About Forecasting
Before discussing the jobs data, I will first discuss why people interested in forecasting are not always interested in the same things. I divide forecasting exercises into three genres.
Nowcasting/backcasting. Determining what the current state of the economy is, based on observed economic data. Given the publication delay of economic data, we might only be getting a reading on the economy as of a couple of months ago — hence, backcasting. Although this looks very easy to do, if you do it even halfway decently, you will be miles ahead of most of the equity, credit, and crypto analysts who opine on macro.
Longer-term forecasting. Forecasting where the economy will likely be in one to two years. To do this, you need to be able to nowcast, and have a reasonable grasp of macro principles. My suggestion is to throw out anything you learned if you took Economics 101, and pick up some heterodox (mainly post-Keynesian) authors. My bias is to favour writers in the Modern Monetary Theory, based on the their track record in the previous cycle. That said, I think that if you choose more intellectually flexible authors (e.g., not big name New Keynesian or Austrian economists), they have relatively improved. I highly recommend my primers on the business cycle and interest rate cycles, but otherwise, Hyman Minsky's writings are quite popular in financial markets for a reason.
Attempting to accurately forecast data over the next few months or quarters. This is how I would classify most street research. There are a lot of people already doing this, and I never saw a reason to go into that space. My interest was in longer-term strategies, with one-year targets being typical. This meant that even though I monitored market chatter, short-term trading was mainly interpreted as waiting for an opportunity to get better entry levels. Although a lot of people love writing about these short-term movements, I am not convinced about the track records of anyone other than sell side proprietary traders. (In addition to having the most expensive analyst talent, they also saw trading flows.)
The differences between the Household and Establishment surveys only matter for analysts interested in the last type of forecasting. What happened in the latest month, and what does is mean for the coming months? If you are trying to forecast high frequency economic moves, you need to be jumpy and rely on leading indicators. However, if you are nowcasting, you are generally averaging (in some sense) a wide variety of data in order to avoid getting mislead by noise.
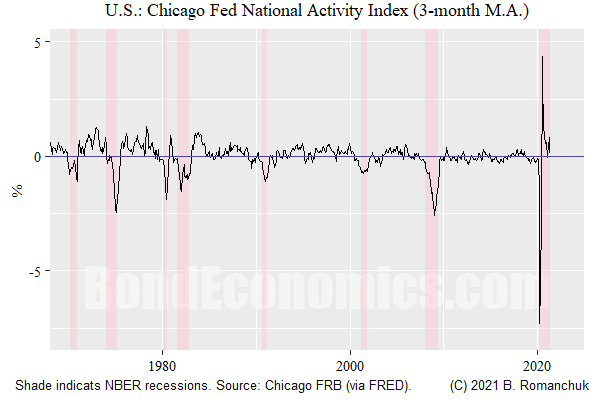
For someone interested in gauging the overall trends of data, you need to look at “averages” of data. This can be done a number of ways. One popular method is to create a dash board or chart pack of favourite indicators. Another is to create composite indicators (which used to be a big part of my day job at the beginning of my career). The more”modern” approach is to use principal component analysis, like the Chicago Fed National Activity Indicator (above). The idea is that you want to see the underlying trend of data. (I just showed the chart to show the reader what it looks like; the indicator was obviously disrupted by the pandemic, and is just calming down now.)
Bias Towards the Household Survey
My bias is to prefer the Household Survey. Since it is a smaller survey, the data are noisier, and so you want to smooth them out. (I am not a huge fan of moving averages, but a 3-month moving average does the job, and is easy to explain.) Smoothing with a moving average introduces a small time lag, but that is not too much of an issue for nowcasting.1 It also has the advantage of not being revised, unlike the Establishment Survey.
The Household Survey is also measuring what we want to know: how much of the labour force is employed? Will labour shortages appear, which might lead to inflationary pressures (depending on what you believe about the formation of inflationary pressures)?
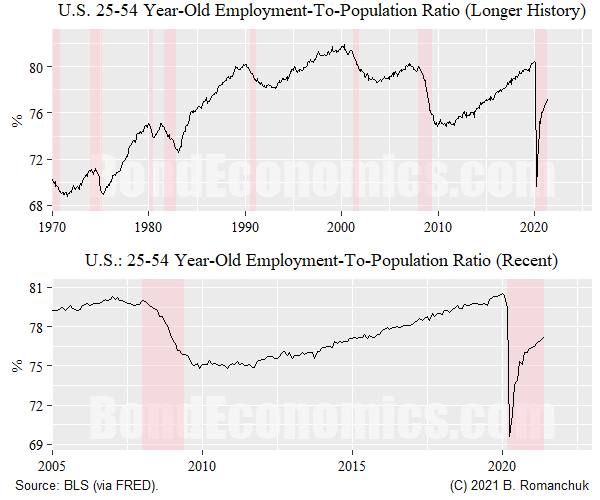
My favourite labour market indicator in the United States has been the employment-to-population ratio. This is the percentage of the population that is considered employed. (It is not one hundred percent less the unemployment rate (in percent), since the unemployment rate is the percentage of the labour force that is unemployed, where the labour force is the part of the total population that is either working or looking for work.) Since older cohorts tend to drop out of the labour force, the figure above is “prime age” workers — 25 to 54 years old.
The top panel shows the post-1970 history. What we see is that the level tended to rise over time, as women entered the labour force. This limited the effectiveness of the employment-population ratio, since it there was a secular change obliterating historical norms. However, that transition has largely finished, and so we see more stable cyclical behaviour of the variable since the 1990s.
As might be expected, there was an unprecedented plunge in 2020. However, the ratio has retraced quite a bit of ground since then. If we want to believe this indicator, the U.S. labour market is in better shape than the worst of the Financial Crisis, but is a long way from “overheating.” This matches my intuition, but I caution the reader that I am not attempting to do in-depth real time economic data analysis (since there are already too many competitors doing that better than I could already).
Concluding Remarks
My advice is to not worry about the latest data points, rather to look at the trend. I tend to trust the Household data more, and I am comfortable with the premise that although things have improved in the labour market, we should be reverting to slower trend growth, similar to last cycle.
Footnote
A moving average is equal to a centered moving average -- one of the best non-causual ways to smooth a series -- plus a lag (half the length of the moving average). See my denunciation of the Hodrick-Prescott Filter for more information about the centered moving average.
No comments:
Post a Comment
Note: Posts are manually moderated, with a varying delay. Some disappear.
The comment section here is largely dead. My Substack or Twitter are better places to have a conversation.
Given that this is largely a backup way to reach me, I am going to reject posts that annoy me. Please post lengthy essays elsewhere.