(This is the first time I ran into anyone using “term spread” instead of “slope.” One could argue that it is a better term than slope — in other contexts, a slope is a rate of change, while a yield curve “slope” is a level difference between two points on the curve. Although it might catch on with the youngsters, I see having two words instead of one, with both of those words having multiple uses within fixed income, “slope” is more convenient for writing. In any event, either is infinitely superior to the practice of (mainly older) economists using “yield curve” to refer to a particular slope, when the yield curve is itself is the plot of yields versus the continuum of maturities.)
I do not have time to look into what is presumably the most important part of their article — crisis prediction. Instead, I just want to make some comments on yield curve behaviour, mainly in places where I have some methodology concerns.
“Normal” Slopes
The following passage is the one that raised my eyebrows the most.
In normal times, a bond with a longer maturity fetches a higher rate on the market due to increased duration risk. However, in the lead up to an economic downturn, various factors can alter the shape of the yield curve. Changes in risk attitudes and search for yield, central bank policy actions, and international demand for safe assets can all influence the term spread and drive the yield for short-term debt closer to or even above the yield for long-term debt.
I will immediately note that this is a textual aside that attempts to explain an empirical regularity: why are yield curve slopes normally positive in an expansion, and tend to invert ahead of a recession? It could be deleted (and if I were a hypothetical reviewer, that is what I would push for) and the rest of the paper remains intact. As such, it is a tangential point — but I think it is a tangential point that may be of interest to my readers, so I will explain my concerns.
The first part of the statement “a bond with a longer maturity fetches a higher rate on the market due to increased duration risk” could be rephrased as “increasing duration risk implies an increasing term premium as a function of maturity, and so we expect that the term spread is positive.” The problem with that formulation is straightforward when we use more precise language: the term spread (slope) is not just the difference in term premia, it is also the difference in the expected policy rate path. The authors do not write this explicitly, but they seem to assume that the expected policy rate change is “normally” near zero — or at least small relative to the term premium.
This brings us back to the area of the term premium, where I am firmly in the camp that the academic/central banking community is collectively out to lunch with their methodologies to estimate it. In any event, I cannot think of any plausible term premium model that suggests that the 10-year term premium is larger on average than the 10-year-to-overnight rate slope.
An alternative way of interpreting that statement is that they assume that “normal times” means that the economy is at equilibrium, and thus the risk-adjusted expected rate curve is flat (which is a normal assumption for someone with neoclassical training). However, if we apply a sensible term premium estimate, the term premium-adjusted curve can deviate from flat for a significant portion of the business cycle. (There are exceptions, like the ZIRP era in Japan, and Anglo countries with housing markets that are sensitive to the short rate — Australia and the U.K., at least.) This would mean that “normal” does not refer to a time average.
As for the remainder of the passage, I would argue that [expected] central bank policy actions do the heavy lifting in driving down the slope. If we look at the “conundrum” episode in the mid-2000s (which the authors reference), the people who were confused by bond market behaviour were generally not the top interest rate strategists.
Mixing and Matching Eras — Not a Fan
The authors look at a long history of 10-year and 3-month rates in order to get a decent sample size. The problem with that is straightforward: they are using data from wildly different currency regimes. They include the following.
Gold Standard era, with its war finance eras.
World War II and the associated financial controls.
The highly regulated Bretton Woods system, which featured interest rate regulations in the major countries that I am aware of. Those regulations started to be dismantled in the 1970s in the United States, while some other countries only took those steps in the 1980s.
The modern largely free-floating fiat currency era — although Europeans kept plugging away with peg systems and then most adopted the euro.
It is not very complicated: if bond yields are regulated, then do not expect them to be the greatest economic indicators. The Gold Standard case is less obvious, but it is clear that there is less room for interest rate volatility in that system, so we expect somewhat different bond market behaviour.
To do an apples-to-apples comparison for future episodes for free-floating currency issuers, we ought to confine our attention to the post-Bretton Woods era, for countries that did were not restricted by currency pegs. The correlation of business cycles since the 1990s means that ends up effectively being a very small sample to work with.
Since the authors are sticking with a very simple concept: inversion around recessions/crises, this concern about mixing currency regimes might not matter, since behaviour was not totally different. As such, I would be cautious and want a split by currency regime, but I accept that such a split might not affect the big picture.
Inversions Are Supposed to Predict Rate Cuts
The next issue is the thorny question of slope inversions and recessions. This was a topic that I deferred to the second volume of my recessions analysis. (I released Volume I after the pandemic had hit, but it was mainly written before.)
The problem is that American analysts have triumphantly noted that American recessions were (almost?) all preceded by inversions of some segment of the yield curve.
The problem is that basic fixed income theory tells us that the yield curve is supposed to be the expected path of the overnight rate (plus term premium, sigh). Curves are supposed to invert when the central bank is expected to cut.
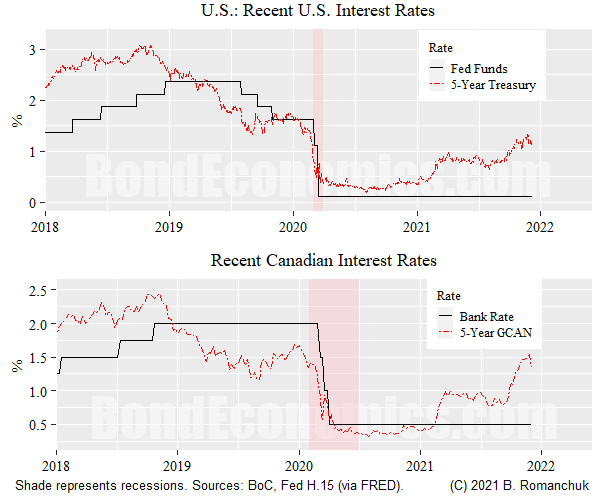
The two conflicting explanations were set up to conflict in 2019: the 5-year Treasury dipped below the overnight rate in March (top panel, chart above). The Fed did cut rates starting in the third quarter — going “team rate cut”’s way. If the economy did not fall into recession — which seemed possible in late 2019, the streak for “team recession prediction” would have been broken. However, COVID hit, and the rest is history.
(I added the Canadian chart to show that the curve inverted in the Great White North, even though there were no rate cuts until the recession hit. “Team predicts rate cuts” might try to explain that one away by saying that the Canadian curve was just doing its “trading as a spread to USTs” thing.
The way to square the circle is to admit that central banks are not as forward-looking as neoclassical models suggest: they tend to only cut rates when a recession looms, and those cuts are not enough to forestall recession.
In fact, most empirical puzzles about yield curve slopes can be explained by assuming that the central bank reacts with a lag to historical data, and makes rapid panic rate cuts when the financial system is under stress. Since this conflicts with the embedded ideology of neoclassical economists, do not expect to see empirical analysis of that hypothesis in the “top” journals any time soon.
Financial Crises
Finally, we need to look at “financial crisis” prediction. The authors use a standard database of crises, which is what one would expect neoclassical authors to do. However, from the perspective of a Minsky-ite, almost all of recessions since the mid-1960s were the result of “financial crises.” There are exceptions. We can have policy induced recessions (2020, post-World War II demobilisation), those due to shocks that are “exogenous” with respect to the domestic economy (mainly oil shocks), and the brief period of cautious financial practices in the immediate aftermath of the Great Depression and World War II. However, as Minsky documented, “animal spirits” returned to the business sector. For more details, I will refer the reader to Chapter 5 of my Recessions: Volume I.
If we look at the post-1990 era, we had the Savings & Loan crisis in the early 1990s, and the blowing up of tech financing in the early 2000s, and then Financial Crisis. The experience of the Financial Crisis changed behaviour enough that we had a recession without a financial meltdown in 2020.
As such, I think we would need to think more carefully about what the qualifications for a “financial crisis” are.
As for the question as to why slopes could “predict” financial crises: what would you expect? For a financial bubble to be dangerous economically, it needs to be fuelled by credit, not equity. And if it is big enough to cause a crisis, the bubble creators will need to tap into the bond markets. It is quite hard for bond portfolio managers to not notice a portion of their portfolio blowing up.
One might respond: since equity markets are also often involved, why are stock prices less useful as an indicator? Although I have some opinions, my polite response is to ask some equity managers to answer that one on their asset class’ behalf.
No comments:
Post a Comment
Note: Posts are manually moderated, with a varying delay. Some disappear.
The comment section here is largely dead. My Substack or Twitter are better places to have a conversation.
Given that this is largely a backup way to reach me, I am going to reject posts that annoy me. Please post lengthy essays elsewhere.