This section offers a short overview of the inflation experience in a few developed countries for relatively recent history – from 1914 for the earliest case. To keep the book brief, in other sections I mainly show data from the United States, with a few exceptions. As a Canadian, I am not a fan of American-centric content, but from a big picture standpoint, the overall inflation experience was similar across countries, albeit with differences in the magnitude of inflation, as well as when inflation came under control. The usual experience was relatively stable inflation in the 1950s to early 1960s, then an acceleration in the 1970s, then a reversal with stable low inflation rates starting in the 1990s.
The situation was more diverse in developing countries, some of which experienced long stretches of high inflation (if nor hyperinflation – Section 2.5). My background comes from following the developed markets, and I prefer not to stick my neck out too far into territory I am unfamiliar with. As such, I am confining my remarks to developed countries, and generalisations I make should be understood with that context.
Ye Olde Days
The period I am discussing was an inflationary period, which was considered unusual. Before World War II, currencies tended to be tied to gold – the various incarnations of what we refer to as The Gold Standard. The usual experience was that prices tended to be stable in the long run. There were disruptions, most notably wars that were associated with rising prices. However, officialdom then pursued deflationary policies to return prices to where they were earlier.
This certainly affected how people thought about money and prices. Thomas Piketty made the following observation about literary classics in Chapter 2 of Capital in the Twenty-First Century:
In eighteenth- and nineteenth-century novels, money was everywhere, not only as a abstract force but above all as a palpable concrete magnitude. Writers frequently described the income and wealth of their characters in francs or pounds, not to overwhelm us with numbers because these quantities established a character’s social status in the mind of the reader. Everyone knew what standard of living these numbers represented.
Things changed in the twentieth century. To use a more low-brow example than Piketty, the monetary demands of supervillains in 1960s movies were a laughingstock in the 1997 movie Austin Powers: International Man of Mystery (“One million dollars!”).
We can see how the trend changed when we discuss the history of the Canadian CPI. However, we only have official CPI data that starts at the tail end of the pre-Bretton Woods Gold Standard era. There are price series, but they were developed by academics, and there may or may not be academic controversies associated with them.
I am not going to dwell on the Gold Standard experience for two reasons. The first is that we live in a world of fiat currencies, and I am writing about that world. The second is that a significant number of people have decided to base their personalities upon the wonders of the Gold Standard and the evils of fiat currency, and even the slightest misstatement by myself would provoke instant blanket condemnations of everything else within this text.
The only thing I want to discuss in respect to this is the often-stated belief that fiat currencies must suffer inflation. As we will see in the discussion of Japan, this is not really the case.
I will now step through some observations about a few selected countries.
The United Kingdom
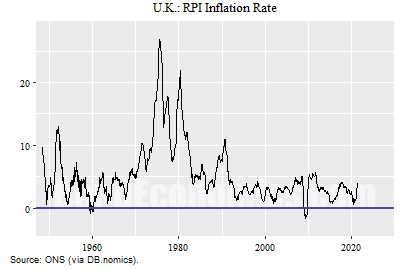
The United Kingdom generally faced higher inflation than the United States after World War II, but still followed the same pattern of peaking in the early 1980s. The chart above shows headline Retail Price Index (RPI) inflation rates. There was a burst of inflation that happened in the late 1980s that coincided with the Lawson Boom as well as an oil spike that happened with the first Gulf War. After that inflation petered out, inflation rates largely stabilised (other than some oil price related shenanigans).
One thing that separates the United Kingdom from North American experience is that the United Kingdom had more difficulties with its currency. The higher inflation rate in the United Kingdom than its trading partners meant that the pound was often overvalued during the Bretton Woods period, and the government was forced to devalue its peg versus the U.S. dollar, which was embarrassing. (For those readers who are not familiar with the Bretton Woods system, it was a framework where countries pegged their currencies versus the U.S. dollar, and the dollar was backed by gold. This structure was needed as the United States had ended World War II with most of the world’s gold reserves, making it impossible for other countries to directly peg their currencies to gold.)
The misadventures with pegging continued after the demise of the Bretton Woods system up until the United Kingdom joined the Exchange Rate Mechanism (ERM). The exchange rate mechanism was the forerunner to the euro and was a de facto pegging of currencies to the German deutschemark. Within a pegged currency zone, interest rates are generally forced to converge – in this case to German rates. Those rates were lower than British households were used to, and coupled with other reforms, led to a housing boom (the Lawson Boom mentioned earlier). However, the economic dislocations created by German reunification pushed up interest rates, and the pound was once again overvalued. This led to the famous speculative attack on sterling that drove the U.K. out of the ERM. (This was viewed as most embarrassing by the Brits I talked to, while us students who had foreign currency scholarships thought it was great.)
This experience has meant that many Britons have very different attitude towards currencies than is the case in North America, at least among commentators in financial markets. (I do not know what polling of the population at large would tell us.) The reasons are straightforward.
Although the U.S. dollar was the centre of the global financial system, American policymakers preferred to only discuss policy in terms of its domestic effects. (Policymakers now might pay more attention to global matters after the Global Financial Crisis of 2008.) The Secretary of State John Connally best summarised the attitude by saying the dollar “is our currency, but your problem.”
The Canadian dollar floated almost the entire period after 1950 (there was a currency peg in that period that lasted less than a year). Although I remember jokes about the Canadian dollar dropping versus the U.S. dollar back in the senior Trudeau government’s day in the 1970s, but since then, the value of the Canadian dollar attracts only limited attention. (Admittedly, some of members of the Canadian establishment do have fainting spells about the Canadian dollar when it is politically convenient.)
The increased sensitivity to currency movements often translates into greater concerns about currency weakness leading to domestic inflation.
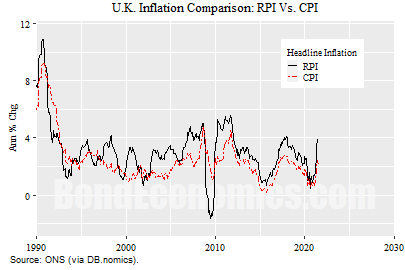
One thing that one might observe that RPI inflation after the 1990s was higher than was the case in the United States. In the figure above, I zoom in on the post-1990 period, and compare the RPI with the newer Consumer Price Index (CPI). The CPI was designed to fit into harmonised European statistical methodologies, and thus reflects more recent academic research on price indices. Although the RPI and the CPI move in the same direction, most of the time RPI inflation is higher than the CPI.
Although the U.K. statistical agencies and government believe that the CPI is a better measure of inflation, the RPI (or other indices based on the RPI) are used in things like pension inflation adjustments. As such, there is a lot of controversy about using the CPI – pensioners want to be paid as much as possible.
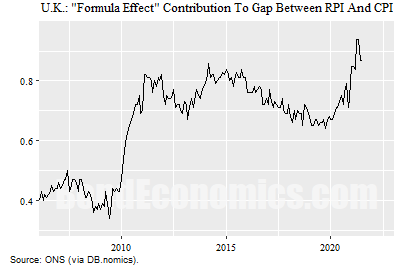
Although some might expect that the difference is due to monkeying around with the components of the price indices, the calculation methods matter. The chart above shows the contribution of the “formula effect” to the gap between the RPI and CPI. It started off at a reasonable 0.4% per year, but then moved to around 0.8% per year after 2010. Although it is debatable whether one can really notice a difference of 0.8% per year in prices, that is a considerable portion of the total inflation rate in a low inflation environment.
For more information on this topic, the Office of National Statistics (ONS) has put a free book on the internet – Measuring the Economy, edited by Jonathan Athow and Joe Grice. Inflation measurement in the United Kingdom is the topic of chapter one.
I do not have an opinion regarding whether either index is “better,” although I feel that the old vintages of consumer price index calculations (like the RPI) did overstate inflation versus other economic variables. This is not the popular view – the inflation measure that is higher is always “correct.” Instead of getting upset about statistical procedures, my view is that the sensible take away is that measuring aggregate prices is complicated, and just simple things like averaging price changes differently results in differences that are a large portion of the total inflation measurement in a low inflation environment. We need to treat all aggregates with suspicion.
Canada
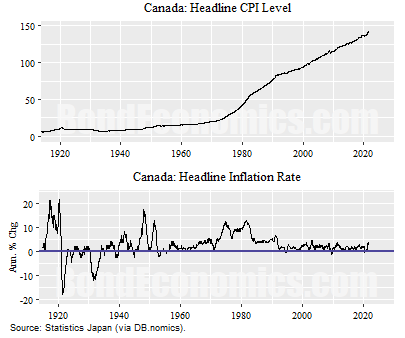
Continuing within the Commonwealth, we visit Canada next. The above series for headline inflation provided by StatsCan starts in 1914 – allowing coverage of the inter-war Gold Standard.
The top panel shows the level of the CPI. It bounces along at a low level until the 1970s, at which point it appropriately takes on a hockey stick shape. (TK: Should convert to log scale, but will have to fix later.) The earlier period did see some wild swings during World War I and the Great Depression, but we see that the inflation during World War I was met by a deflation after the war. Such a deflation did not happen after World War II. Inflation marched up until it became a serious concern in the 1970s (which I can personally attest to). Inflation rates then moderated.
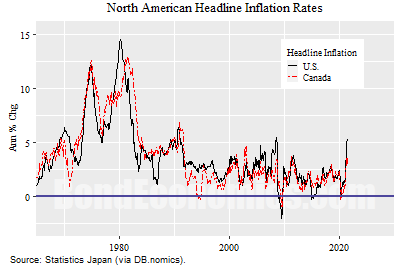
The figure above superimposes Canadian inflation with that of the United States. As can be seen, they moved together. (This is helped by the fact that I used headline inflation, and so gasoline price spikes tend to hit both countries similarly.) One may note that it is effectively impossible to pick out any large deviations between the countries – even though the Canadian dollar has been quite volatile versus the U.S. dollar over the shown period.
Japan
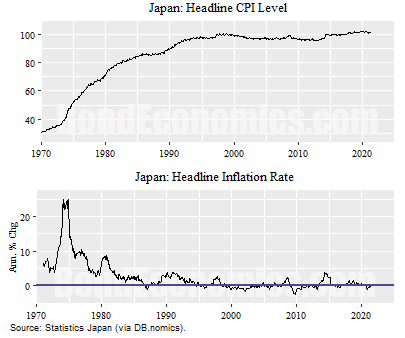
Japan is one developed country that definitely does not fit the inflation pattern seen by the United States. Japan was hit hard by the 1970s oil price shock, but then inflation rates trended downward. Although there was a small peak in inflation rates around 1980 (bottom panel), one could argue that the inflation trend was broken earlier.
From the information in this chart alone, we cannot really pick out the effects of an economic event that affected Japan very differently from the rest of the developed world: the Japanese investment bubble and bust that ran from the mid-1980s to early 1990s. The post-1990 inflation story is quite interesting.
The top panel shows the level of the CPI. Since the mid-1990s, the level has been bouncing around the 100 level. Looking at the bottom panel, we see what must happen: small periods of positive inflation followed by periods with negative deflation (deflation).
If you look at hand-wring commentary from American pundits, Japan has been trapped in “deflation” since the bubble popped. However, that was a wild exaggeration. Instead, Japan has achieved price level stability: the inflation rate on average is 0%.
For New Keynesian economists, price level stability is allegedly a disastrous state to be in. Visiting American academics repeatedly lectured Japanese officials that they needed to achieve 2% inflation. The Japanese responded by announcing a target of 2% inflation – which they continue to miss, year after year.
Whether Japanese officials are incompetent or are just play-acting to keep American academics happy is a question that might only be answerable by Japanese officials (who certainly are not going to enlighten me).
We can also draw an important lesson from this: inflation is not pre-ordained, even for a fiat currency. It is a policy choice. The conventional view is that a low level of inflation is the best policy, and so it should not come as a surprise that we end up with a relatively low inflation rate.
Final Remarks
I cannot write a comprehensive history of inflation in the developed countries and keep the book near its desired length. However, there is enough of an overlap of experiences that we do not need to look at each country’s history to discuss each point of interest. That said, we need to keep Japan in mind as an example of a non-inflationary fiat currency.
References and Further Reading
Piketty, Thomas. “Capital in the 21st Century.” Cambridge, MA: President and Fellows, Harvard College (2013). ISBN: 978-0-674-43000-6
Measuring the Economy, Edited by Jonathan Athow and Joe Grice. U.K. Office of National Statistics. URL: https://measuringtheeconomy.uk/
No comments:
Post a Comment
Note: Posts are manually moderated, with a varying delay. Some disappear.
The comment section here is largely dead. My Substack or Twitter are better places to have a conversation.
Given that this is largely a backup way to reach me, I am going to reject posts that annoy me. Please post lengthy essays elsewhere.