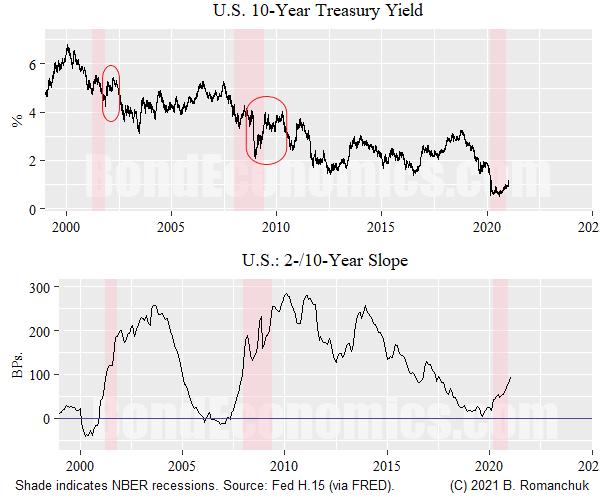
The sell-off in the Treasury market is following the footsteps of other mini-bear markets that have happened at the tail end of recessions. Barring some economic fireworks, it is entirely likely that yields will enter range-trading mode. For now, the question remains as to what levels the bear phase stalls out at.
The top panel of the chart above shows the 10-year Treasury yield. We see that similar bear phases happened at the tail end of the previous two recessions. What is not obvious from this chart (but would be from a total return chart) was that those were buying opportunities: yields range-traded and/or drifted lower, generating good carry and rolldown returns.
Although I can imagine surprise scenarios where the Fed moves earlier, I would argue that the probability distribution is heavily weighted towards the first rate hike appears in early 2023 or later. A glance at the calendar tells us that is a lot of Fed speeches to wade through before anything remotely interesting happens. The length of this horizon tells us that a "sell and hold" strategy is not going to be sustainable.
(People may get excited by short-term spikes in economic data, which are to be expected as vaccination coverage increases. Once those are worked through, we will back to the slow-moving trends seen in the last cycle. From my perspective, the largest source of upside uncertainty is the possibility of the Republican Party falling further into disarray, creating greater room for a fiscal push.)
For those of us who are believers in rate expectations, the valuation story is straightforward: look at the instantaneous forward curve, compare it to our personal Fed forecast, and buy or sell duration based on that. That said, not everyone agrees with this, and want to have elaborate theories about bond trading. One possible approach is to look at past history, and attempt to draw analogies about timing of bear/bull markets.
If we look at past history, we have two contradictory signals.
- Carry and rolldown trades are winners in the aftermath of recessions, and we wait years for rate hikes.
- The valuation cushion built into the curve is non-existent when compared to past cycles. (This is illustrated by the relative flatness of the 2-/10-year curve, as shown in the bottom panel.)
An alternative phrasing: the last interest rate cycle tells us you want to be a carry and rolldown pig at this stage of developments, but we do not have the carry cushion that existed then. So, we are stuck with "past results are not indicators of future performance" -- which any reader of sell-side research disclaimers is well aware.
(If I had to give investment advice, I would probably mumble something about relative value.)

No comments:
Post a Comment
Note: Posts are manually moderated, with a varying delay. Some disappear.
The comment section here is largely dead. My Substack or Twitter are better places to have a conversation.
Given that this is largely a backup way to reach me, I am going to reject posts that annoy me. Please post lengthy essays elsewhere.